

Open interest is the total outstanding exposure in a crypto perpetual market that has not been closed. It rises when new positions create additional contracts and falls when existing positions are closed, but it does not reveal whether traders are collectively bullish or bearish because every open contract has both a long and a short side.
The metric is most useful when read beside price, trading volume, funding and market depth. Rising open interest shows that more exposure is staying in the market; falling open interest shows that exposure is being removed. Neither change is a trading signal by itself, and neither measures the number of individual traders.

Open interest records outstanding exposure, not trading activity
A perpetual trade connects opposing positions. When a new long is matched with a new short, one contract is created and open interest increases by one contract. When both sides close, that contract disappears and open interest decreases. A transfer from one trader to another can generate trading volume without changing the total amount left open.
This accounting makes open interest a stock measure rather than a flow measure. It describes the position exposure remaining at a point in time, while volume describes how much trading occurred during a period. The CME explanation of open interest uses the same core distinction for futures: opened contracts add to the total, closed contracts subtract from it, and volume counts contracts traded.
| Transaction outcome | Open interest | Trading volume | What changed |
|---|---|---|---|
| A new long meets a new short | Increases | Increases | New exposure enters the market |
| A new trader takes over an existing position | Unchanged | Increases | Ownership changes, but exposure remains |
| One side reduces while another adds | Often unchanged | Increases | Exposure is transferred rather than removed |
| An existing long and short both close | Decreases | Increases | Outstanding exposure leaves the market |
Contract counts also require context. Some exchanges display open interest in coins, some in contracts and others in a USD-equivalent notional. The CFTC futures glossary provides the conventional futures vocabulary, but a crypto venue’s contract multiplier, settlement asset and calculation method still determine what its displayed number means.
Open interest and volume answer different market questions
Volume measures turnover. A market can record heavy volume while open interest remains flat because positions are repeatedly transferred, reduced and reopened. It can also show modest volume with high open interest when many positions remain outstanding but few traders are changing them during the observed period.
| Metric | Primary question answered | What it cannot prove |
|---|---|---|
| Open interest | How much position exposure remains open | Direction, unique users or available exit liquidity |
| Trading volume | How much notional changed hands during a period | How much exposure remained afterward |
| Order-book depth | How much visible liquidity sits near the market price | Whether displayed orders will remain during stress |
| Funding rate | Which side pays to keep the perpetual near its reference market | The size or quality of the order book |
| Price | Where the most recent transaction occurred | Why exposure entered or left |
Open interest therefore answers how much exposure remains, not how easy that exposure is to trade. Volume helps show current activity, while order-book depth and spread show the immediate execution environment. Funding adds the cost of keeping one side balanced against the other. Coinwy’s centralized perpetual exchange comparison shows why these fields must be checked at contract level instead of inferred from an exchange-wide headline.
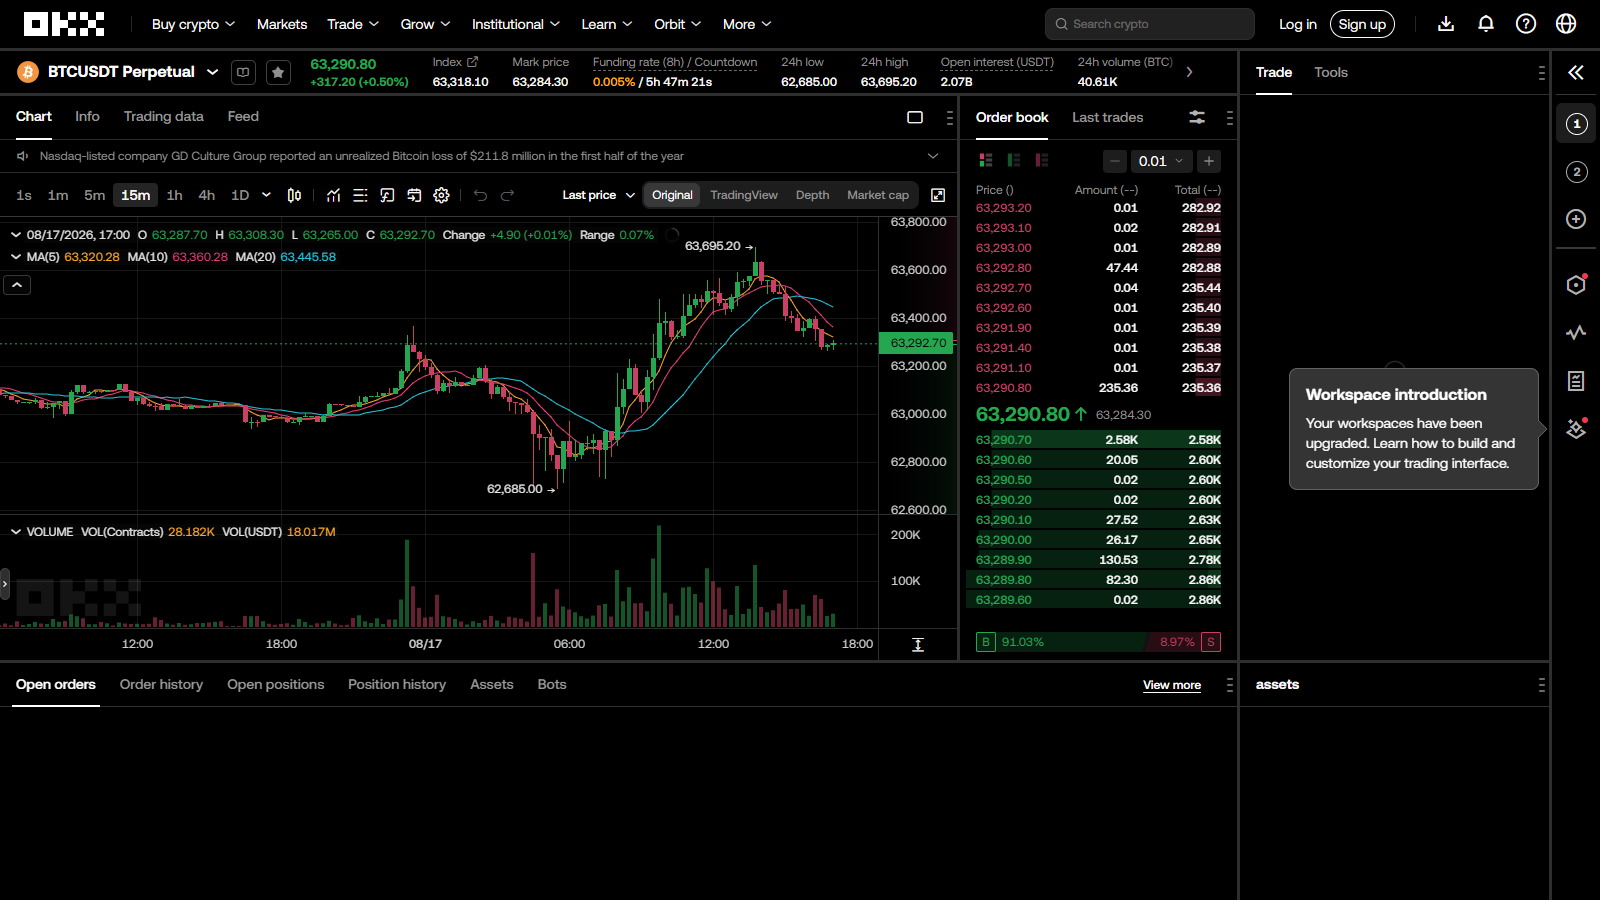
The public OKX BTC-USDT perpetual market places open interest beside index price, mark price, funding and 24-hour volume. That arrangement is useful because no single field has to carry an interpretation it cannot support.
Price and open interest form a four-state market map
The direction of price and the direction of open interest create four useful states. These states describe how exposure is changing; they do not identify the motive of every participant. A rising market with increasing open interest may contain directional longs, short hedges, basis trades and market-maker inventory at the same time.
| Price | Open interest | Strongest initial reading | Important alternative explanation |
|---|---|---|---|
| Rising | Rising | New exposure is entering during an advance | Hedgers or new shorts may be absorbing demand |
| Rising | Falling | Positions are closing during the advance | Short covering may be driving part of the move |
| Falling | Rising | New exposure is entering during a decline | New shorts, hedges or arbitrage positions may dominate |
| Falling | Falling | Exposure is being removed during the decline | Long exits or liquidations may be accelerating the move |
Persistence matters more than one isolated reading. A burst of rising price and open interest can reverse when a listing opens, collateral changes or arbitrage exposure shifts between venues. Several observations separate durable expansion from a temporary jump.
The matrix becomes more useful when a market is compared with its own history rather than with an unrelated contract. BTC open interest and a thin altcoin’s open interest can have different units, participant mixes and exit capacity. Coinwy’s broader perpetual crypto exchange pillar provides the venue context that a raw open-interest figure cannot supply.
Funding shows the pressure attached to open exposure
Funding identifies which side is paying under a venue’s balancing mechanism. Positive funding commonly means longs pay shorts, while negative funding commonly means shorts pay longs, subject to the exchange’s formula and schedule. Open interest supplies the scale of outstanding exposure; funding supplies information about positioning pressure and carry.
| Open-interest change | Funding condition | Practical interpretation |
|---|---|---|
| Rising | Strongly positive | More exposure is open while longs pay meaningful carry |
| Rising | Strongly negative | More exposure is open while shorts pay meaningful carry |
| Rising | Near neutral | Gross exposure expands without a large visible payment imbalance |
| Falling | Funding remains extreme | Positions are leaving, but the remaining side is still crowded |
| Falling | Funding normalizes | Exposure and carry pressure are both easing |
Rising open interest with persistently positive funding can indicate that long exposure is becoming expensive to maintain. The same open-interest rise with negative funding can indicate stronger demand for short exposure. Neutral funding does not make the market neutral, because offsetting positions, capped rates or balanced demand can keep the payment small even when gross exposure is large.
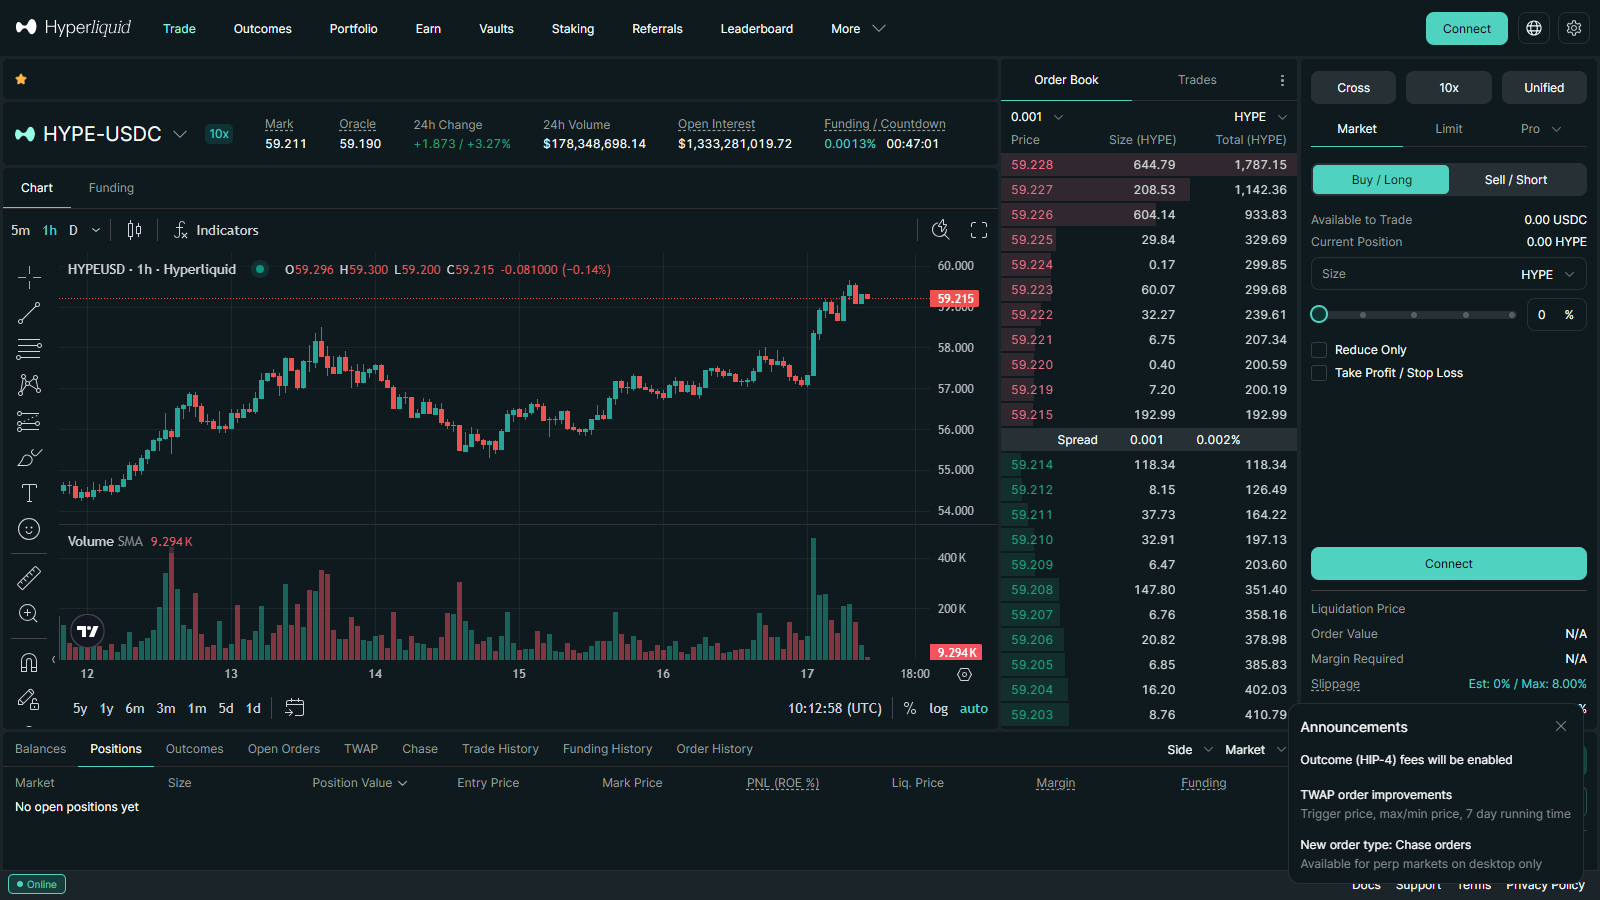
The Hyperliquid market interface shows open interest, funding, oracle price and volume for the selected perpetual. Reading those fields together is more informative than treating a high open-interest figure as automatic evidence of conviction.
Open-interest concentration can amplify liquidation cascades
Large outstanding exposure becomes fragile when it is supported by narrow collateral buffers and concentrated near similar liquidation levels. A price move can push the first group below maintenance margin, forced reductions can consume available order-book depth, and the resulting price impact can trigger the next group. Open interest does not reveal every liquidation level, but it helps define the amount of exposure that could participate in the process.
Mark-price methodology, margin mode and backstop design determine how that pressure is transmitted. Cross margin can connect one position to a wider collateral pool, while isolated margin limits the collateral assigned to a specific position. Oracle-priced pool venues and order-book venues can absorb forced flow differently, as the Ostium oracle incident demonstrates from a venue-risk perspective.
The most concerning combination is not simply high open interest. It is rapidly expanding exposure, one-sided funding, thinning depth and price moving toward a dense liquidation area. The opposite combination, falling open interest after a sharp move, can show that leverage is being removed, although it cannot confirm that the market has reached a durable bottom or top.
High open interest does not guarantee deep liquidity
A market can carry substantial open interest while offering poor execution near the current price. Positions may have accumulated when conditions were better, may be held by a small number of accounts or may be split across hedged strategies that do not provide executable quotes. Visible depth can also disappear when volatility rises.
Execution quality depends on spread, depth at the intended order size, fill behavior and the route available during liquidation or withdrawal. That distinction is central to the best perpetual DEX selection guide, which compares venue models rather than ranking them by one headline number.
Open interest can still support liquidity analysis when paired with turnover and depth. High open interest with healthy volume and stable depth suggests that outstanding positions have an active market around them. High open interest with low turnover and a thin book describes exposure that may be difficult to unwind. Low open interest with high short-lived volume can describe speculative churn rather than durable participation.
Exchange open-interest figures require normalization
A coin-margined contract may report the underlying asset, a linear contract may report stablecoin notional, and a venue may convert contract counts into a current USD value. The general conversion is:
Open-interest notional = outstanding contracts × contract multiplier × reference price
Consider 1,000 contracts with a multiplier of 0.001 BTC, representing 1 BTC of exposure. At $60,000, displayed OI is $60,000. If BTC rises to $66,000 while the contract count stays fixed, displayed OI becomes $66,000. The 10% increase came entirely from price.
To compare venues, retain the native contract count where available and use one reference price and timestamp. Venue specifications control because inverse, linear and coin-margined products can use different calculations.
| Comparison field | Required normalization | Error avoided |
|---|---|---|
| Contract type | Linear, inverse or coin-margined | Treating unlike payoff structures as equivalent |
| Display unit | Contracts, coins or USD notional | Comparing raw numbers with different scales |
| Price basis | Current price or fixed contract value | Mistaking price-driven notional change for new positions |
| Settlement asset | Stablecoin, fiat or crypto collateral | Ignoring collateral volatility |
| Market scope | One contract, one venue or aggregate | Mixing a market figure with an exchange-wide total |
| Timestamp | Same observation time | Comparing asynchronous snapshots |
Cross-exchange totals can also double-count economically hedged exposure. A desk may be long on one venue and short on another, creating open interest on both exchanges while maintaining limited net market direction. Migration between venues can reduce one platform’s figure and increase another without changing the trader’s overall exposure.
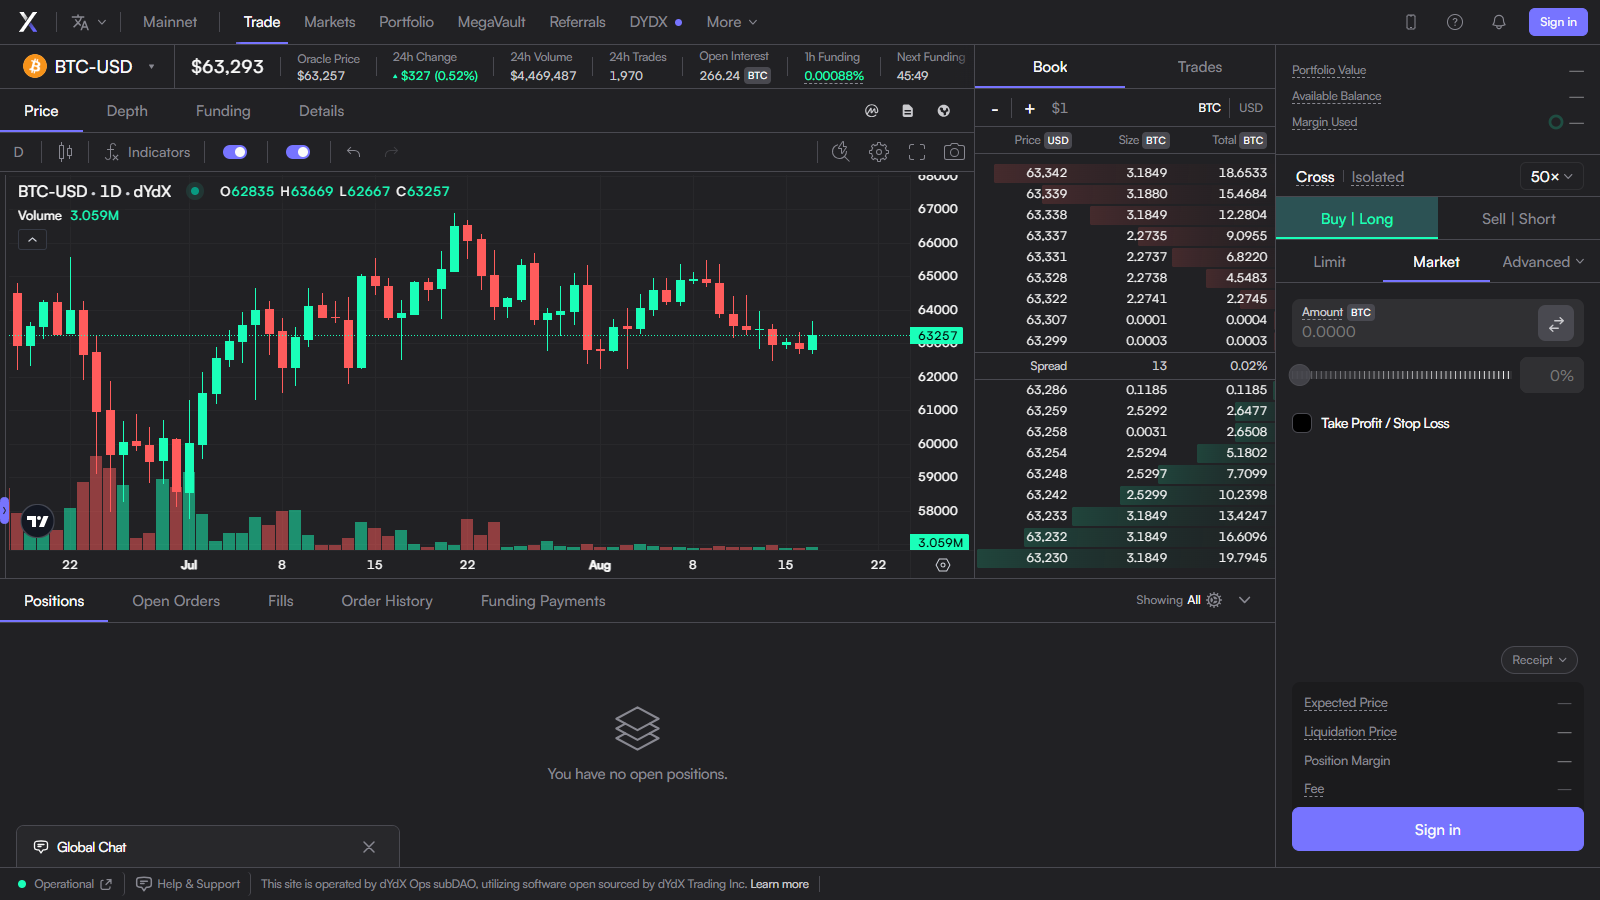
The public dYdX BTC market displays open interest alongside oracle price, volume, trade count and funding. Its figures should be compared with another venue only after the unit, contract and timestamp have been aligned. For venue-specific structural differences, the Hyperliquid versus dYdX comparison separates scale from custody and chain design.
Open interest is most useful during three market transitions
During a breakout, expanding open interest shows that exposure is being added rather than merely closed. Volume and depth establish executable participation, while funding shows whether one side is paying heavily. Falling open interest instead suggests position closure is doing more of the work.
During a crowded carry trade, open interest shows gross exposure while funding indicates recurring payment pressure. Offset spot and perpetual legs mean large OI and extreme funding can coexist without one shared directional view. Coinwy’s report on Bybit funding-rate limits illustrates why rate parameters matter.
During a liquidation-driven move, a rapid decline in open interest can confirm that positions are being removed. Price impact, liquidation prints and depth reveal whether the unwind is orderly or cascading. A perpetual delisting can also force exposure toward a defined close or settlement process.
Common open-interest reading errors
- Treating rising OI as bullish: It proves that more contracts remain open, not whether the new risk belongs to longs, shorts, hedgers or arbitrageurs.
- Equating OI with unique traders: One participant or strategy can create positions across several accounts and venues.
- Using high OI as a liquidity score: Outstanding positions are not resting bids and asks. Spread, depth and realized fills remain the relevant execution evidence.
- Comparing totals without matching units and scope: A USD exchange total and a coin-denominated single-market figure cannot form a valid ranking.
- Reading one snapshot as a trend: A sequence aligned with price, funding and volume provides stronger evidence.
Conclusion
Open interest measures the crypto perpetual exposure that remains outstanding, not market direction, trader count or guaranteed liquidity. Its value comes from showing whether exposure is expanding, transferring or being removed while price changes.
The strongest reading combines open interest with price, volume, funding and depth, then normalizes the contract unit and timestamp before comparing venues. That framework turns open interest from a headline statistic into a practical view of participation, crowding and liquidation risk.
Frequently asked questions
Does rising open interest mean crypto prices will rise?
No. Rising open interest means more exposure remains open. The new positions can include longs, shorts, hedges and arbitrage trades, so price, funding and market depth are needed to interpret the change.
Can open interest be negative?
No. Open interest is a count or notional value of outstanding contracts and cannot fall below zero. The change in open interest can be negative when more exposure closes than opens during the measured period.
What is the difference between open interest and trading volume?
Open interest measures contracts that remain open at a point in time. Volume measures contracts traded during a period, including transfers and closes that may leave total open interest unchanged.
Why do exchanges report different open-interest numbers?
Venues can use different contract types, display units, conversion prices, settlement assets and market scopes. Meaningful comparison requires the same asset, contract definition, timestamp and notional unit.
Disclaimer: This article is for informational purposes only and does not constitute financial or investment advice. Cryptocurrency and digital asset markets carry significant risk. Always do your own research before making decisions.
Related: Hyperliquid Reaches $6 Billion in Open Interest on May 12, 2025
Related: Ozak AI Audit Readout: What CertiK and Sherlock Actually Confirmed
Related: Stablecoins draw bank interest as Barclays issues RFI
Related: US, UK, and Canada Crypto Fraud Crackdown: What Operation Avalanche Shows
Related: CME Surpasses Binance in Crypto Futures Open Interest
Related: Bybit Ranks No. 2 in Open Interest Among Major Crypto Exchanges, Leads CEXs in OI-to-Volume Ratio